360is gets paid to make information technology go faster.
Sometimes its hardware which doesn't hit the stated performance, or software which cant fully utilise the capability of modern hardware. Sometimes it's a lifetime extension for an old platform, squeezing in another 18 months growth before a replacement arrives. If we are really lucky we get to re-design an entire end-to-end process and make it more efficient. More layers and more abstraction means more scope for performance problems, so virtualisation has been a rich seam for us. With Citrix release of XenServer Creedence Alpha 2 (XSCA2) should we be worried? Is it time to throw in the towel on IT performance-tuning and setup that high-end bicycle-shop-come-espresso-bar we've always talked about?
We've been following XenServer performance from the start, and have a tome of magic spells to instrument and improve network, storage, and CPU performance. Without resorting to black-magic we were interested in seeing how XSCA2 performed straight out of the box.
Firstly let me say that all we have time for here is the most superficial of testing. Large sequential reads and writes are the 0-60 time of the storage world. That is to say, while they have some value, unless your use-case is an out-and-out drag race this test probably isn't a good approximation of the kind of performance you will see in your applications. Single VM large sequential read/writes are even more of a corner-case. If you only had a single VM to run you should probably run physical, just a suggestion...
Secondly, XSCA2 is alpha, and so it is slightly unfair subjecting it to a performance benchmark.
Finally, we used the equipment we had spare in the lab at the time. The storage back-end is puny. We had a handful of 10Krpm spindles and SSDs laying about. Out in the real world, 360is regularly deliver 1.5GB/sec to 2GB/sec of storage bandwidth (at high IOPS) to Hypervisors and physicals of one kind or another either over local or network storage.
The Goal
We were interested to see how XSCA2 performed against XenServer 6.2, against physical, and against "Brand-X" Hypervisor, all of which were "out of the box".
The Test
The test couldn't have been simpler. For a 2 vCPU VM, for each of 9 record sizes (64KB-16MB), we write (or read) 8GB of data and measure the performance in MB/sec for each record size. Why 2 vCPUs? Adding more doesn't change the results. Why 8GB? We can be sure 8GB blows through any caching that may be happening on disks, RAID controller, VM, or Hypervisor. Even at a 16MB record size, 8GB takes a lot of writes. For the physical test case we force direct IO to get around the fact that the physical system has much more RAM than 8GB. We use the same guest Operating System, installed in the same way for each of the VM tests. Everything is thick provisioned. This isn't a test of how fast each configuration can be made to go, it is a test of how fast each actually goes, straight out of the box on the lab system that was available at the time.
Tuning
None. No changes to the default install of XenServer, Brand-X Hypervisor, the CentOS VM or physical instance, with the exception of taking XSCA2 out of debug mode. No CPU pinning, no IO scheduler changes, no disk/virtual disk alignment, no IRQ balancing, no interrupt coalescing, no filesystem tweaking, no queue size alteration, no waving of dead chickens or reciting of incantations.
Results
Enough talk, on with the results:
 | |
| 8GB Streaming Write At A Variety Of Record Sizes |
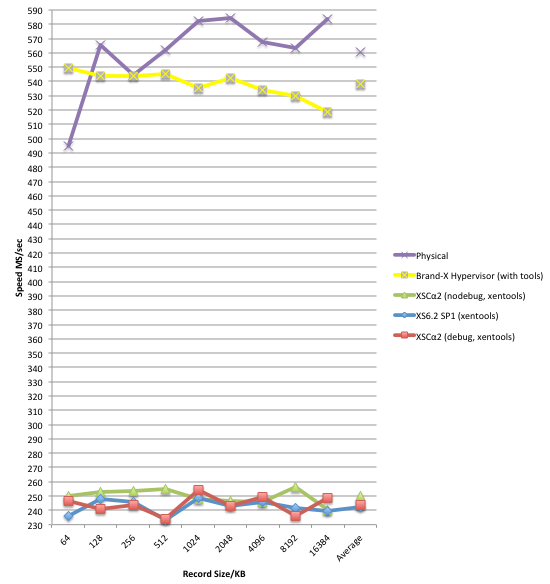 |
| 8GB Streaming Read At A Variety Of Record Sizes |
On this system, for this test, XSCA2 is an improvement over XS61-SP1, but is still significantly behind the physical, and more disappointingly behind the other well known brand of Hypervisor. Besides the obvious, there are a few points from the chart which warrant further investigation for starters:
- High jitter in all XS results.
- Odd dip at the 512KB record size test on both XSCA2 and "Brand-X" hypervisor.
- Slow start to the physical test at 64KB record size.
Conclusions
- We aren't out of the performance tuning business just yet it seems!
- There is a significant difference in performance between the physical and "Brand-X" and XenServer.
- Read performance is particularly disappointing for XenServer in this test.
"It is easier to repair a bucket with a big hole, than an inner tube with a slow puncture." - Ancient 360is Engineer's Proverb.
For this system, for this test, the hole in the bucket is large, with a bit of further investigation it shouldn't be too hard to find. XenServer Dom0 (which strictly speaking we don't care about) comfortably achieves ~600MB/sec in read performance tested using "dd" with direct IO (no cache effect), so we know the problem is with the guest disk virtualisation IO path. First port of call will be instrumenting CPU consumption in the guest and Dom0, paying particular attention to XSCA2 susceptibility to numa-effects on the CPUs. We love a mystery. The game is afoot!
Further Information
Test VM Spec.
CentOS6 x86_64 Linux, default install from distribution, updated with "yum update" 3-07-2014, with the following additional packages: wget, openssh-clients, iozone (3.424-2 x86_64). 2 vCPUs, 1GB RAM, 20GB virtual hard disk.
Test Hardware Spec.
AMD 6176 CPUs (x2), 192GB 1066MHz RAM, LSI 9260-4i RAID, 3x WD1000DHTZ, 2x SSDSC2BW12.
Test Hardware OS.
CentOS6 x86_64 (same as VMs).
Brand-X Hypervisor.
Latest version, chose the PV SCSI device.
Benchmark.
We used the continuous benchmarking feature of VMCo Virtual Estate Manager (VEM). VEM's benchmarking alerts administrators to performance regressions in your XenServer or VMware estate, whether they be caused by bugs, patches, hardware problems, subtle interactions between network elements or administrator misconfiguration. VEM's continuous benchmarking shows you where the performance regression is, when it started, and it's impact is.


2 comments:
You will probably want to read this:
http://xenserver.org/blog/entry/tapdisk3
@Anonymous, we've been following the work on tapdisk3 with great interest, and It's a surprise the out-of-the-box performance in our simple-case test compared so poorly to out-of-the-box physical or Brand-X running the same test. Something for me to work on next week.
Post a Comment